Recent searches
Search options

#GermanEnergyFact #1 ctd.
If you think that the renewable share is still fairly small, and the #Energiewende needs to speed up, you are right! But also consider that a shift toward wind & solar and electrification of heating and mobility "automatically" decrease primary energy consumption, as it is much less wasteful compared to, e.g., electricity generation in thermal power plants and internal combustion engines. So expect overall PEC to decrease and the RES share to increase fairly quickly.
#GermanEnergyFact #1 ctd.
To put the German ~40,000 kWh per capita consumption into comparison: According to @ourworldindata (only 2021 data available so far), the  per capita PEC is about twice the
  average, around a third more than
  's, and a bit above the
  average.
But it is only about two thirds of the  per capita PEC, and a bit more than half of the
  .
.
Sources:
AGEB: https://ag-energiebilanzen.de/energieverbrauch-faellt-2022-auf-niedrigsten-stand-seit-der-wiedervereinigung/
Or World in Data: https://ourworldindata.org/grapher/per-capita-energy-stacked?country=Africa~Asia~AUS~CHN~European+Union+%2827%29~DEU~OWID_WRL~USA~GBR~South+America~ZAF~SAU~QAT
Next #GermanEnergyFact will be shorter, promise!
#GermanEnergyFact #2: Let's have a closer look at the development of the fossil part of primary energy consumption in . We regularly track this in the #openenergytracker, where I also take the following graphs from. Zoom- & clickable graphs and underlying data here: https://openenergytracker.org/en/docs/germany/energyconsumption/#fossil-energy-primary-consumption
 Between 1990-2022, fossil #primaryenergyconsumption decreased by 28%. 2020 saw the lowest consumption so far, driven by the pandemic. In 2021, consumption increased again because of economic recovery.

#GermanEnergyFact #2 ctd. In 2022, fossil primary energy consumption slightly decreased again, driven by soaring #energyprices. The government aims to achieve #climateneutrality by 2045. As there is no explicit target or path for phasing out fossil primary energy consumption, we assume an indicative linear reduction path between 2021, the starting year of the current German  coalition, and 2045 The 2022 fossil primary energy consumption is above that path (zoomed in graph).


#GermanEnergyFact #2 ctd. The share of natural #gas in fossil primary energy consumption increased from 18% in 1990 to 35% in 2020; in line with a narrative of natural gas a "bridge fuel" for the #energytransition. This trend reversed in 2022, driven by Russia's attack on #Ukraine and its consequences for German gas supply: gas consumption decreased by 15% (!) between 2021 and 2022. Conversely, the consumption of both hard #coal and #lignite increased by 5% each, and oil by 3% 2021-2022.


I planned to post more facts about German energy consumption in this first week of the new year, but for a current occasion, here is a small digression: Today, the first ever (regular) #LNG tanker #MariaEnergy arrived in Germany.
Not so fun fact: it is natural #gas produced from #fracking.
Story: https://www.dw.com/en/first-lng-tanker-arrives-at-germanys-new-floating-terminal/a-64272015
While this first ever #LNG shipment received a lot of media attention, and it certainly is a significant event, let's put it in perspective:
#GermanEnergyFact #3 ctd.
Since September 2022, the residential and commercial sectors in already saved natural #gas equivalent to 21.5 (!) average #LNG tankers purely because of changes in behavior. This is what my colleagues @aroth and Felix Schmidt found in an analysis that we constantly update on the #DIW #Ampelmonitor #Energiewende: https://www.diw.de/en/diw_01.c.841560.en/ampel-monitor_energiewende__monitor_of_the_german__traffic_light__coalition___s_energy_transition_targets.html#ab_862329
More graphs and info on the methods used are available in the #openenergytracker: https://openenergytracker.org/en/docs/germany/naturalgas/

#GermanEnergyFact #4: Electric vehicles 

Again, I wanted to continue with energy consumption facts... but because of current events, I HAVE to talk about electric cars! Today new must-see #KBA data came out. All data and zoomable graphs also available in the #openenergytracker: https://openenergytracker.org/en/docs/germany/emobility/
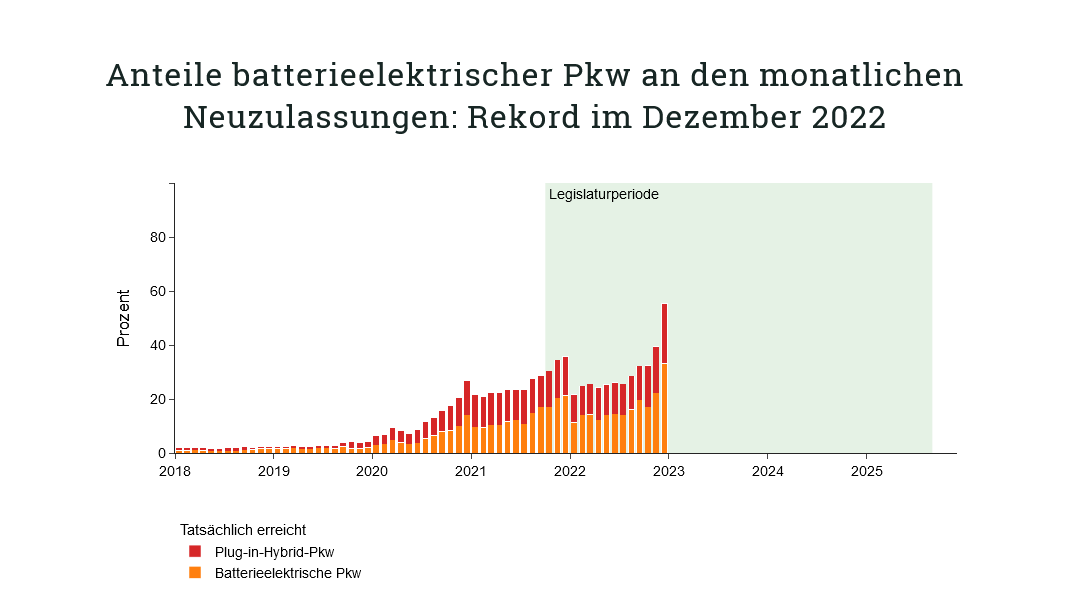
December 2022: Highest-ever share of battery-electric vehicles (#BEV) in new #car registrations in , 33.2%! Also, a record share for plug-in hybrids (#PHEV) in December with 22.2%.

#GermanEnergyFact #4 ctd.
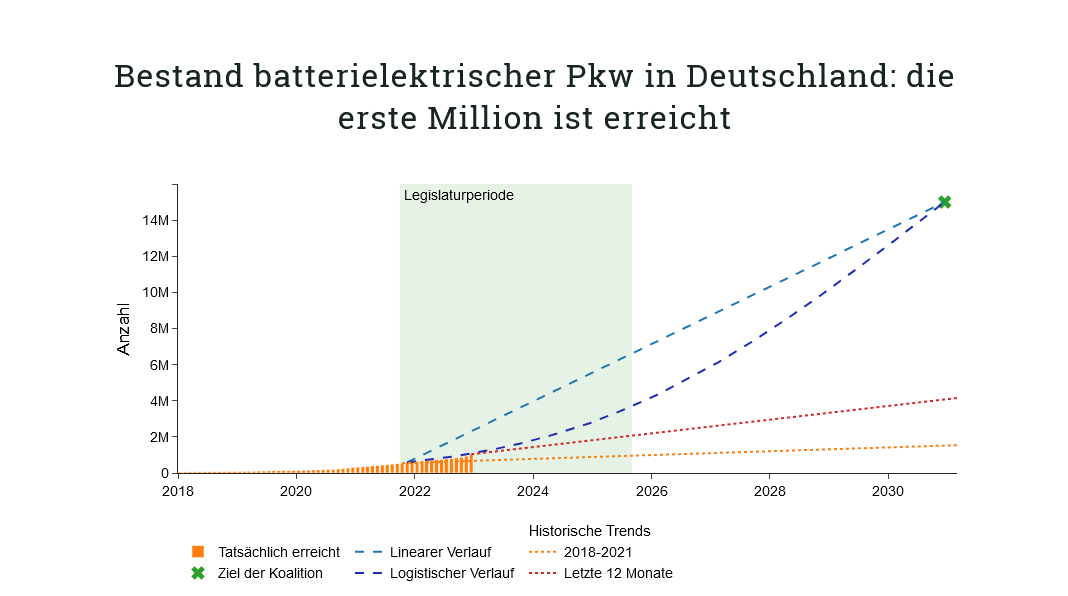
That is, more than 55% of all new cars in December 2022 had a plug . In the very motherland of the internal combustion engine  This record month was probably driven by reduced purchase subsidies from January 2023 on: no more subsidies for plug-in hybrids, and max. subsidy for BEV now €4500 (was 6000€). Also important: with this record month, the fleet of pure battery-electric cars in now surpassed 1 million
  Still way to go to reach 15 mio by 2030...


#GermanEnergyFact #4 ctd.
Für alle, die es lieber auf Deutsch lesen: zoombare Abbildungen zum Dezember-Rekord bei der #Elektromobilität sowie zur erreichten ersten Million bei der Bestandsflotte batterieelektrischer #Pkw gibt es jetzt auch als kleinen Blog #5 im #DIW #Ampelmonitor #Energiewende: https://www.diw.de/de/diw_01.c.862674.de/nachrichten/ampel-monitor_energiewende__5__eine_million_elektrofahrzeuge__zulassungsrekord_im_dezember.html
#Elektroauto #KBA
#GermanEnergyFact #5: It gets dirty - lets talk about coal.
After two unplanned digressions (LNG and electric cars), I now return to primary #energy consumption facts for , this time focusing on hard #coal. I use new #AGEB data available here: https://ag-energiebilanzen.de/wp-content/uploads/2022/11/03-Steinkohle_2022.pdf
Overall coal consumption increased by nearly 5% in 2022 vs. 2021. #wrongdirection Overall consumption in 2022 was 323 TWh, or nearly 4000 kWh per capita. #thisisstillalot

#GermanEnergyFact #5 ctd.
The increase in hard #coal consumption in 2022 was particularly high for coal used in power plants (+16%), driven by a surge in #electricity prices and increased electricity exports. In contrast, coal used for steel making decreased (-6%). This goes hand in hand with a decrease in steel production of roughly the same size (compare German steel industry press release https://www.stahl-online.de/medieninformationen/rohstahlproduktion-in-deutschland-november-2022/)

#GermanEnergyFact #6 is even more dirty than the last one: #lignite
Here is most recent #AGEB data on lignite for 2022: https://ag-energiebilanzen.de/wp-content/uploads/2022/12/BK-KJ22-erste-Schatzung-09.12.2022.pdf
Primary #energy consumption of lignite in increased by 5% in 2022 vs. 2021. #wrongtrend The overall consumption in 2022 was 329 TWh. That is nearly 4000 kWh per capita #thatsalot! Around 90% of this was used for #electricity generation, which was also up by around 5% vs. 2021, driven by exploding electricity prices

#GermanEnergyFact #6 ctd.
Using these numbers, you can calculate an average efficiency of #electricity generation from #lignite of slightly below 40% in 2022. That is, around 178 TWh of primary energy from lignite went through the chimneys and cooling towers of power plants unused - around 2100 kWh per capita 

#GermanEnergyFact #7: natural #gas
Yesterday, the Bundesnetzagentur released new data on natural gas consumption in 2022: https://www.bundesnetzagentur.de/DE/Gasversorgung/aktuelle_gasversorgung/Rueckblick/start.html
Overall gas consumption in 2022 was 847 TWh, 17.6% less than 2021 Households and commerce reduced consumption by 19.1% (wow!), industry by 16.6% compared to 2021 Savings were driven by much-increased gas prices, warmer weather, and changes in heating behavior Some data discrepancies between BNetzA and AGEB data, but savings trend is similar

#GermanEnergyFact #7 ctd.
Zooming in on #gas savings made by households and commercial consumers: in the #openenergytracker, we regularly differentiate savings components related to temperature and to changes in behavior: https://openenergytracker.org/en/docs/germany/naturalgas/
We find that households and commerce have consistently saved gas by changing their behavior since September 2022. Except for the Christmas week it seems - maybe people wanted to have it as cosy as usual during these days?  Great work by @aroth

#GermanEnergyFact #8: oil
I'm wrapping up this first week with some #oil consumption data for (sorry I'm a bit late, this was a family day), based on recent #AGEB data: https://ag-energiebilanzen.de/wp-content/uploads/2022/12/01-Mineraloel_2022.pdf
Sales of #diesel fuel decreased by 1% from 2021 to 2022, #gasoline +4%, jet fuel +44% (!) Mio t are hard to deal with, so here are derived liter/capita numbers: ~490 l diesel, ~270 l gasoline, ~130 l jet fuel per person. Note: these averages includes all people, also those who never drive or fly.

#GermanEnergyFact #8 ctd.
So I'm clearly not an expert when it comes to supply and demand of oil products; but I found it quite interesting that the sales of diesel fuel hardly decreased despite much higher prices, and gasoline sales even slightly increased.
The post-pandemic surge in jet fuel use is also striking (and worrying).
Thanks for following me through this first week, which largely focused on indicators of #energy consumption. Next week may see a focus on energy #prices, stay tuned!
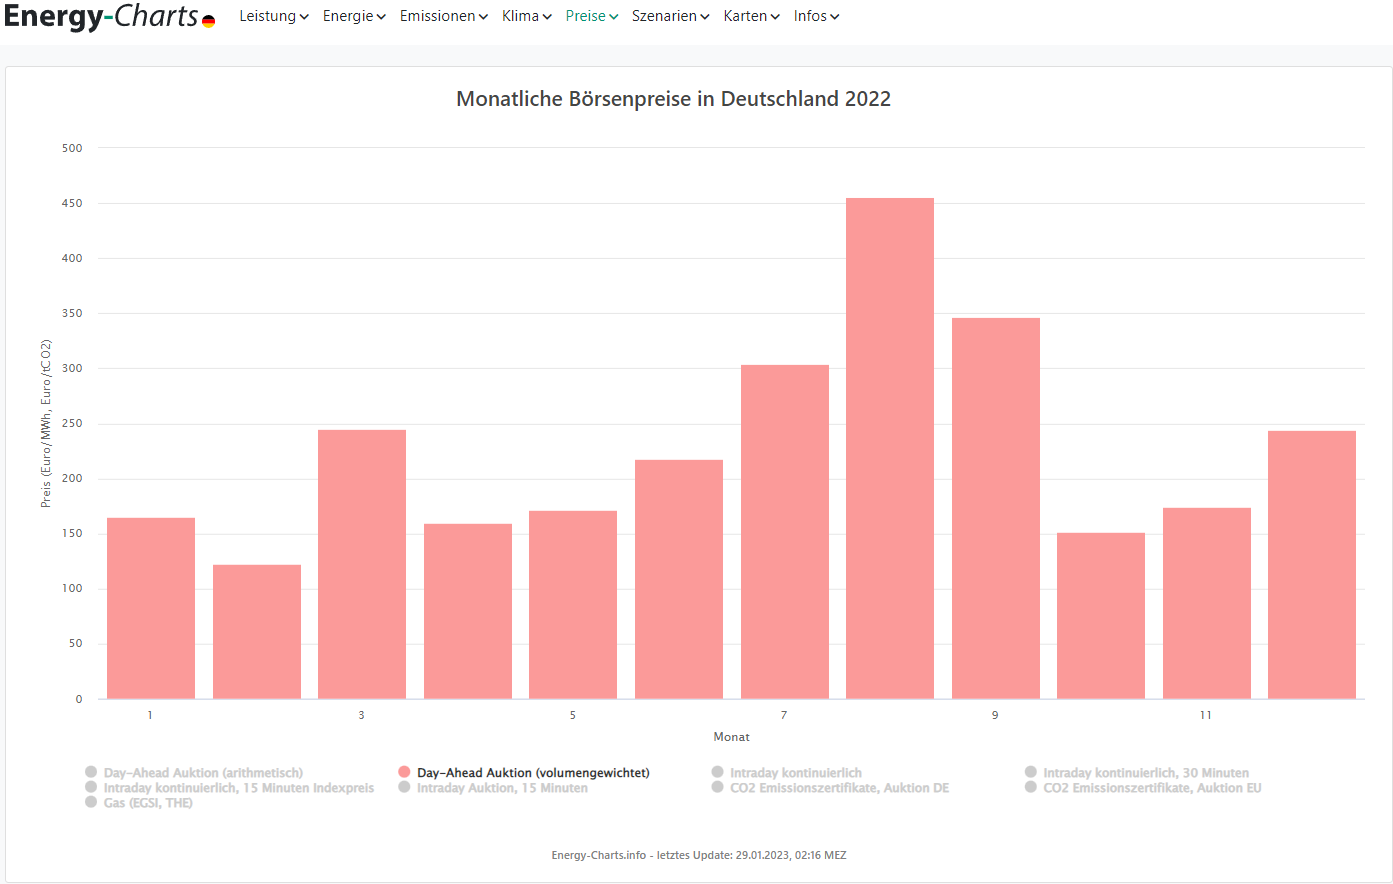
#GermanEnergyFact #9: wholesale electricity prices 

Data provided by the Bundesnetzagentur / SMARD platform shows that 2022 was a record-breaking year in terms of #electricity #prices: https://www.smard.de/home/downloadcenter/download-marktdaten/?downloadAttributes=%7B%22selectedCategory%22:3,%22selectedSubCategory%22:8,%22selectedRegion%22:%22DE-LU%22,%22selectedFileType%22:%22XLSX%22,%22from%22:1609455600000,%22to%22:1672527599999%7D
The average day-ahead wholesale price in more than doubled from around 97 €/MWh in 2021 to 235 €/MWh in 2022 The highest hourly price increased from 620 to 871 €/MWh The price spread also increased a lot: the interquartile range increased from 59 to 176 €/MWh

#GermanEnergyFact #9 ctd.
The wholesale price increase was driven by a surge in natural #gas prices. Further, low generation from hydro power and French nuclear contributed to high prices. Generators with low marginal costs have benefited a lot from this - which lead to a EU-wide temporary revenue cap for generators. Any technology that could offer temporal #flexibility must have made tons of money in 2022. Probably a golden year for electricity #storage and other flex technologies!

#GermanEnergyFact #10: natural gas import prices
A main reason for the surge in wholesale electricity prices (see #GermanEnergyFact #9) is a record increase in natural #gas #import #prices, as gas-fired plants often set hourly electricity prices. Data provided by the Federal Statistical Office of : https://www.destatis.de/DE/Themen/Wirtschaft/Preise/Publikationen/Energiepreise/energiepreisentwicklung-xlsx-5619001.xlsx
Gas import prices in 2022 on average increased by factor 3 compared to 2021, and nearly by factor 7 (!) vs. 2020 (only counting Jan-Nov) The peak month was August 2022
. Prices have increased dramatically in 2022.")
#GermanEnergyFact #11: hard #coal import prices
Not only gas import prices increased a lot in 2022, but also hard coal prices. Again, data provided by the Federal Statistical Office: https://www.destatis.de/DE/Themen/Wirtschaft/Preise/Publikationen/Energiepreise/energiepreisentwicklung-xlsx-5619001.xlsx
Hard coal import prices in 2022 on average increased nearly by a factor 3 vs. 2021, and by a bit less than factor 5 vs. 2020 (only counting Jan-Nov for consistency) This also contributed to increasing electricity prices
(sorry, no graph today, just numbers, as I don't have much time)
#GermanEnergyFact #12: household electricity prices
If you are following this thread, you may recall that German wholesale #electricity #prices increased a lot in 2022, largely driven by high natural gas (and also hard coal) prices. This also led to higher household electricity prices. The energy industry association #BDEW regularly publishes household electricity price data for a typical household in Germany, with fixed price components also allocated to consumption: https://www.bdew.de/service/daten-und-grafiken/bdew-strompreisanalyse/

#GermanEnergyFact #12 ctd.
So, a few key facts: Between 2021 and the second half of 2022, household #electricity #prices increased from around 32 ct/kWh to 40 ct/kWh. The relative increase was much lower than the increase in wholesale prices for two reasons:
i) retailers procure electricity up to around 3 years in advance on future markets, so current wholesale price increases are not fully visible yet;
ii) household prices include various other price components, dampening the effects.

#GermanEnergyFact #12 ctd.
More generally speaking, household #electricity #prices include costs for distribution and metering, regulated network charges, and various taxes, levies and surcharges. In the years 2013 to 2021, these taxes, levies and surcharges accounted for more than half (!) of the household electricity price. In the wake of the current crisis, procurement costs have risen sharply due to high wholesale prices, so the share of taxes/duties/levies fell to under one-third.

#GermanEnergyFact #12 ctd.
The #EEG levy, which has been charged since 2000 to finance the expansion of renewable energy sources, was abolished on July 1, 2022. However, this relief was more than offset by the increase in procurement costs in 2022. You can expect that prices continue to increase in 2023, probably to (or above) 50 ct/kWh.
Click- and zoomable graphs and underlying data (also an inflation-adjusted version) in  , and
, and  in the #openenergytracker: https://openenergytracker.org/en/docs/germany/prices/

#GermanEnergyFact #13: gasoline and diesel prices
Not only the prices of gas, coal, and electricity increased a lot in in 2022, but also consumer prices for #gasoline and #diesel. Again, drawing on recent data provided by the Federal Statistical Office of Germany #destatis: https://www.destatis.de/DE/Themen/Wirtschaft/Preise/Publikationen/Energiepreise/energiepreisentwicklung-xlsx-5619001.xlsx:
Average gasoline prices in Germany in 2022 were 23% higher than in 2021, and 50% above 2020 levels. Diesel prices on average increased by 40% vs. 2021 and by 74% vs. 2020.

#GermanEnergyFact #14: import prices of #oil, #gas and #coal
I conclude my second week of German #energy facts with another price graph, drawing on recent #destatis data: https://www.destatis.de/DE/Themen/Wirtschaft/Preise/Publikationen/Energiepreise/energiepreisentwicklung-xlsx-5619001.xlsx
Striking how import prices of gas and coal increased (and recently decreased) largely in parallel in the wake of Russia's attack on Ukraine. Oil prices also increased, but much less. Note: coal & gas are substitutes in electricity generation to some extent, but oil is hardly used for this in .

#GermanEnergyFact #14 ctd.
Thanks for following me here until now. If you like, please share your feedback: do you find these German #energy facts useful/interesting/boring? For me, it's actually quite a bit of fun, I force myself to look at some statistics which I might otherwise ignore.
Next week, I might focus on renewable energy. Stay tuned, and enjoy the weekend!
#GermanEnergyFact #15: share of #renewables in the #electricity sector
New data for 2022 provided by @BMWK: https://www.bmwk.de/Redaktion/DE/Downloads/Energie/230102-erneuerbare-energien-ueberblick-zubauzahlen-und-beschleunigungsmassnahmen.pdf?__blob=publicationFile&v=4. Click- and zoomable graph in the #openenergytracker: https://openenergytracker.org/en/docs/germany/electricity/#shares-in-the-power-sector
The government aims for a share of 80% renewable generation in gross electricity consumption by 2030. In 2022, this share increased to ~47% according to #BMWK, driven by a better #wind and #solar year, and some expansion of #renewable capacities (particularly solar).

#GermanEnergyFact #15 ctd.
In 2020, the share of #renewable generation in gross #electricity consumption already was as high 45.3%, caused by lower electricity demand during the pandemic. In 2021, the share decreased to 41.0% because of higher electricity consumption in the wake of the economic recovery, and a relatively poor wind year. To reach the 2030 target, the share must grow by more than 4 %-points per year on average from 2021 onwards.
")
#GermanEnergyFact #16: installed capacity of #solar #PV in
I promised this week would focus on #renewables, so let's continue with solar #photovoltaics capacity, using data published today by #AGEE-Stat / #Umweltbundesamt: https://www.umweltbundesamt.de/themen/klima-energie/erneuerbare-energien/erneuerbare-energien-in-zahlen/monats-quartalsdaten-der-agee-stat. Graphs from the #openenergytracker: https://openenergytracker.org/en/docs/germany/electricity/#solar-pv
By the end of Nov 22, PV capacity was 66.1 GW. The government aims for 215 GW by 2030. Currently we are on track, but the expansion speed has to increase to meet the 2030 target.

#GermanEnergyFact #16 ctd.
In Nov 22, this corresponded to 0.78 kW of installed solar #PV capacity per capita. The 2030 target of 215 GW relates to a value of 2.6 kW/capita, assuming a constant population. The 2040 target of 400 GW (!) implies 4.7 kW/capita. That's quite a lot
#energymastodon crowd: What are the values for you country?
Disclaimer: newer data than Nov 2022 is available from the #BNetzA #Marktstammdatenregister, but not reliable yet because of time lags in reporting.

#GermanEnergyFact #17: installed capacity of #onshore #wind power in
Let's continue with onshore wind capacity, again using data by #AGEE-Stat / #Umweltbundesamt: https://www.umweltbundesamt.de/themen/klima-energie/erneuerbare-energien/erneuerbare-energien-in-zahlen/monats-quartalsdaten-der-agee-stat. Graphs from the #openenergytracker: https://openenergytracker.org/en/docs/germany/electricity/#wind-energy
By the end of Nov 22, the installed onshore wind capacity was 57.9 GW. The government aims for 115 GW by 2030. Currently we are below the required expansion path, and the speed has to increase a lot to meet the 2030 target.

: we are currently a bit below the expansion path.")
#GermanEnergyFact #18: installed capacity of #offshore #wind power in
Now, offshore wind, again using data by #AGEE-Stat / #Umweltbundesamt: https://www.umweltbundesamt.de/themen/klima-energie/erneuerbare-energien/erneuerbare-energien-in-zahlen/monats-quartalsdaten-der-agee-stat. Graphs from the #openenergytracker: https://openenergytracker.org/en/docs/germany/electricity/#offshore
By the end of Nov 22, the installed offshore wind power capacity was 8.1 GW. There has been hardly any development for years. But now really plans to get started with a 30 GW target for 2030. In 2023 alone, there will be tenders for an additional 8.8 (!) GW.

#GermanEnergyFact 18 ctd.
That is, Germany will auction more #offshore #wind capacity in 2023 than we currently have. Some kind of #Zeitenwende, if you ask me.
Fun fact: the last auction in September 2022, 980 MW, had a winning bid of exactly 0 ct/kWh: https://www.bundesnetzagentur.de/DE/Beschlusskammern/1_GZ/BK6-GZ/2022/BK6-22-011/Fläche%20N7.2_Bekanntmachung/Bekanntgabeseite.html;jsessionid=7B77119881F4C316887AF897182B1869?nn=709672.
#GermanEnergyFact #19: heat pumps
In 2022, 236,000 new #heatpumps were installed in - a new record! Source: https://www.waermepumpe.de/presse/pressemitteilungen/details/waermepumpenabsatz-2022-wachstum-von-53-prozent-gegenueber-dem-vorjahr/#content The stock of heat pumps increased to nearly 1.7 million (note: this also includes some heat pumps that only provide domestic hot water). The government aims for a yearly addition of 500,000 heat pumps from 2024 on, and a stock of at least 6 mio by 2030.
Additional info, zoomable graph and underlying data on the #openenergytracker: https://openenergytracker.org/en/docs/germany/heat/#heat-pumps
")
#GermanEnergyFact #20: #renewable #electricity generation
Earlier this week, I talked about renewable generation capacity (GW) in (facts #16-18). #AGEE-Stat also provides up-to-date data on renewable electricity generation (TWh): https://www.umweltbundesamt.de/themen/klima-energie/erneuerbare-energien/erneuerbare-energien-in-zahlen/monats-quartalsdaten-der-agee-stat#Quartalsdaten (sorry for the German chart, no time for translation today)
Overall renewable electricity generation in 2022 was a bit above 250 TWh, the highest value ever. The trend is good - but we need much more to make the #Energiewende really happen

#GermanEnergyFact #20 ctd.
#Renewable #electricity generation in was 8% higher in 2022 compared to 2021. Main reasons: it was much windier  , and there were more sunshine hours
  . In addition, #PV capacities also increased (see #GermanEnergyFact #16). The share of variable renewables (wind & PV) in overall renewable generation was 77% (!). You can expect this share to increase further in the future, as all the growth in renewable electricity will come from #wind and #PV.

#GermanEnergyFact #21: complementary monthly generation of #wind and #solar #PV
Today, no hard numbers, just visuals: monthly generation from PV (yellow) in is relatively high between around April and September, while generation from wind power (dark & light blue) is above-average between around October and March. Nice seasonal balancing (on a monthly basis).
Source: #AGEE-Stat https://www.umweltbundesamt.de/themen/klima-energie/erneuerbare-energien/erneuerbare-energien-in-zahlen/monats-quartalsdaten-der-agee-stat#Quartalsdaten
(sorry, again a German graph - but I'm sure you get the point without reading the legend)


#GermanEnergyFact #22: #renewable #electricity generation in since 1990
I'm concluding my week on #renewables with a time series of renewable electricity generation.
Early 90s: < 20 TWh, most of it hydro power. 2022: 253 TWh, more than 13 times as much than 1990. Most of the growth came from #wind and #solar power. This number has to grow >1000 TWh by 2045 in most relevant climate-neutrality scenarios.
Sources: #BMWK (https://www.erneuerbare-energien.de/EE/Navigation/DE/Service/Erneuerbare_Energien_in_Zahlen/Zeitreihen/zeitreihen.html) and #AGEE-Stat (https://www.umweltbundesamt.de/themen/klima-energie/erneuerbare-energien/erneuerbare-energien-in-zahlen/monats-quartalsdaten-der-agee-stat#Quartalsdaten)

#GermanEnergyFact #23: Feed-in tariffs for rooftop #solar #PV
Feed-in tariff for new small-scale rooftop PV installations <30kW in the year 2004:
57.40 ct/kWh
Feed-in tariff for the same new installation in July 2022:
6.06 ct/kWh
Note: The respective feed-in tariffs are granted for 20 years after installation. And both are in nominal prices - i.e. the degression in real terms has been much higher than this.
#GermanEnergyFact #24: A bit more on feed-in tariffs for rooftop #solar #PV
In August 2022, the FIT for new rooftop PV installations <40kW in *increased* again, from 6.06 ct/kWh to 7.10 ct/kWh, or to even 10.90 ct/kWh in case all electricity is fed to the grid and nothing is self-consumed.
The latter is intended to provide an incentive to install the largest possible systems on the entire roof area and not go for smaller installations oriented at maximizing the self-consumption share.
#GermanEnergyFact #24 ctd.
So we are currently trying to incentivize grid feed-in of solar #PV via higher feed-in tariffs to make it more attractive compared to self-consumption.
Fun fact: around 15 years ago, we had the opposite situation: self-consumption was not profitable (retail prices were lower and FITs were very high), so in 2009 a 25 ct/kWh bonus was introduced for self-consumed electricity.
The people who locked this in for 20 years must be really happy today...
#GermanEnergyFact #25: remuneration for utility-scale solar #PV
While the FIT for rooftop PV installations <40kW in is currently 7.1 ct/kWh (or even 10.9 ct/kWh in case no electricity is self-consumed), remuneration for utility-scale PV is markedly lower. In Nov 2022, the last auction brought an average strike price of 5.8 ct/kWh.
Utility-scale PV operators receive the difference between this price and the average monthly market value of all PV plants as a premium.
Hm, it seems I forgot to post a #GermanEnergyFact yesterday. How come no one noticed? 
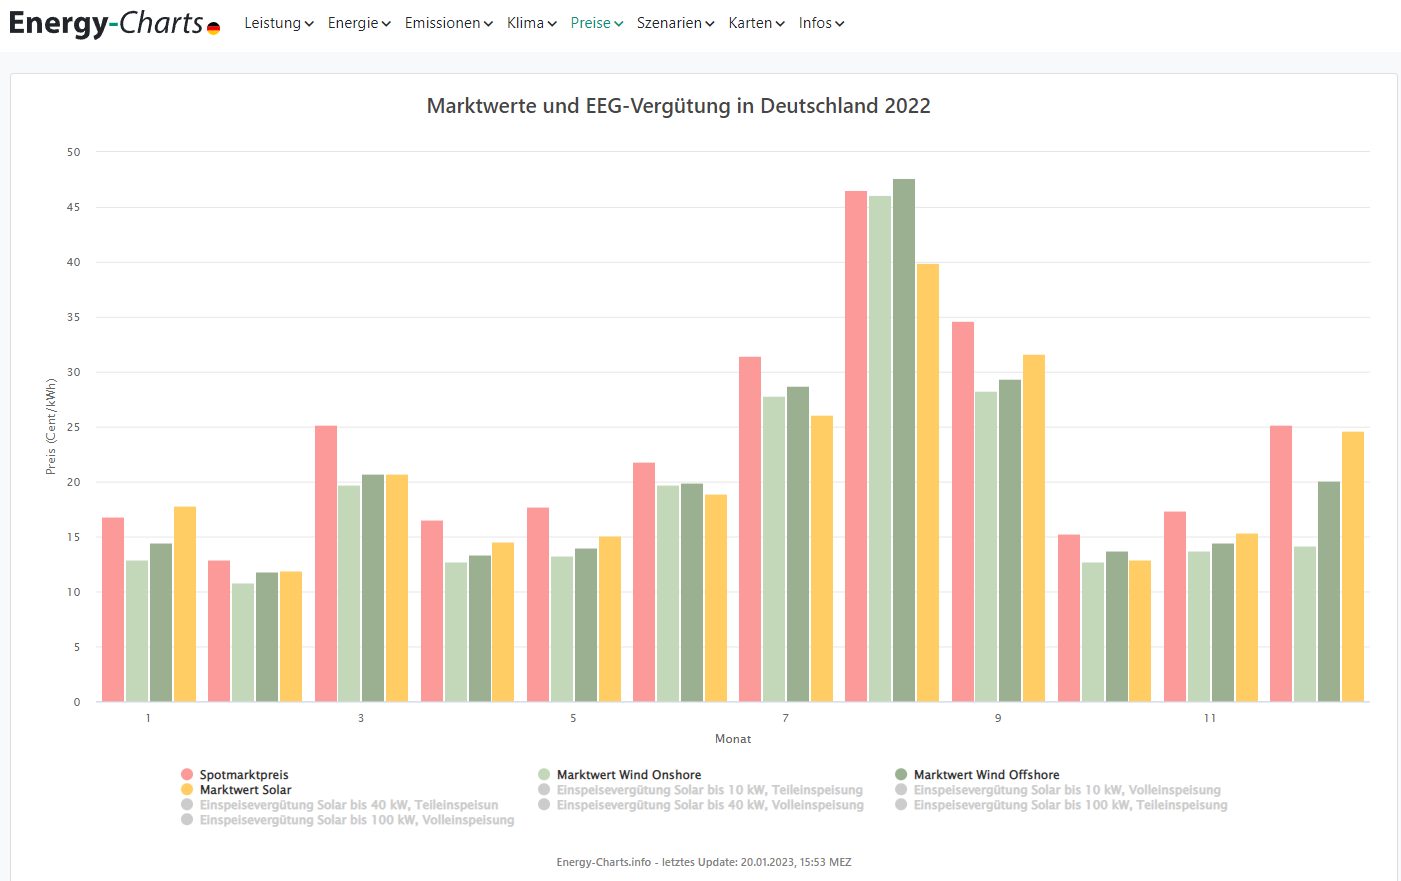
So, here is #GermanEnergyFact #26: remuneration vs. market value of #solar #PV in
5.8 ct/kWh: strike price for utility-scale solar in the last auction (Nov 2022) 7.1 ct/kWh: current feed-in tariff < 40 kW 10.9 ct/kWh: current feed-in tariff < 40 kW in case of full grid feed-in 22.3 ct/kWh: average yearly market value of solar PV in 2022
Source: https://www.netztransparenz.de/EEG/Marktpraemie/Marktwerte
#GermanEnergyFact #27: market values of variable #renewables 2022
2022 saw not only record-breaking electricity prices, but also extraordinary market values for #wind and #solar. Average spot price and market values:
Solar #PV: 22.3 ct/kWh (95% of average prices) #Offshore wind: 18.3 ct/kWh (78%) #Onshore wind: 16.3 ct/kWh (69%)
Data: https://www.netztransparenz.de/EEG/Marktpraemie/Marktwerte

Since I'm still a day behind, here comes another one right away, #GermanEnergyFact #28: average yearly market values of #wind and #solar power in since 2020
Market values generally followed the exploding market price. There seems to be increasing "cannibalization" of wind power. I don't see why the market value of PV (relatively) increased in 2022. As the monthly values also look differently, there may be a data error. Anyone who knows more about this? @aurelwuensch @marcowuensch

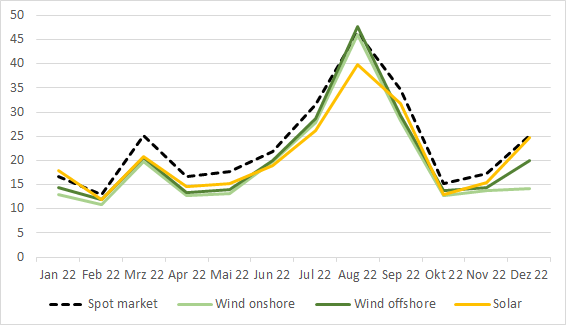
#GermanEnergyFact #29: more on market values of variable #renewables in
I thought, let's stick to this topic for a while. So here is a view on absolute monthly market values of #wind power and #solar #PV since 2018
Both spot prices and market values of renewables hit a historic low in 2020 during the pandemic. Since mid 2021, market prices massively increased, largely because of higher gas prices. Wind and PV market values largely followed this trend.
Data: https://www.netztransparenz.de/EEG/Marktpraemie/Marktwerte

#GermanEnergyFact #30: more on market values of #renewables in
While the last post showed *absolute* values, here are monthly market values *relative* to spot prices since 2018:
In general: market value of PV > offshore wind > onshore wind Solar market values peak in winter. The general pattern has been quite persistent, even during the COVID pandemic. Only in mid 2022, where spot prices peaked, #wind market values were above #PV.
Data: https://www.netztransparenz.de/EEG/Marktpraemie/Marktwerte

#GermanEnergyFact #31: more on market values of #solar #PV in
Hope you're not bored yet, but here is another graph which I find interesting, focusing on PV market values relative to spot prices:
Market values are relatively high in winter, partly >100% (but production is very low in these months) In summer, they decrease because of the merit order effect Values also decrease over time with increasing PV penetration, some call it "cannibalization effect"
Data: https://www.netztransparenz.de/EEG/Marktpraemie/Marktwerte
. Market values decrease in summer and also over time with increasing renewable generation.")
Woah, we're already in the second month of your favorite thread of daily German #energy facts!
So here is #GermanEnergyFact #32 - the first of a series of fun facts on #renewable energy legislation in :
How often word variations of the expression "market" (Markt) appeared in the first German Renewable Energy Sources act #EEG of the year 2000: 
How often variations of "market" are mentioned in the current 2023 version of the same law #EEG: 

#GermanEnergy Fact #33:
Target mentioned in §1 of the Renewable Energy Sources Act #EEG 2000: to at least double the share of #renewables in total #energy consumption by 2010.
Share of renewables in primary energy consumption 2000: 2.9% Share of renewables in primary energy consumption 2010: 9.9%
Share of renewables in gross electricity consumption 2000: 6.5% Share of renewables in gross electricity consumption 2010: 17.1%
Data: https://www.bmwk.de/Redaktion/DE/Artikel/Energie/energiedaten-gesamtausgabe.html
#GermanEnergyFact #34: How often word variations of "storage" (Speicher) appear in different versions of the Renewable Energy Sources act (Erneuerbare-Energien-Gesetz, EEG):
First EEG version of the year 2000:  Current EEG of 2023:
#GermanEnergyFact #35: How often word variations of "negative prices" appear in different versions of the Renewable Energy Sources act (Erneuerbare-Energien-Gesetz, EEG):
First EEG version of the year 2000: Current EEG of 2023: 
Back from holidays, I realize that I'm still one post behind schedule, so here is #GermanEnergyFact #36 (which also concludes my mini series of fun facts about EEG 2000 and 2023):
How often does the expression "coal phase-out" (Kohleausstieg) appear in different versions of the Renewable Energy Sources act (Erneuerbare-Energien-Gesetz, #EEG):
First EEG version of the year 2000: Current EEG of 2023: 
#GermanEnergyFact 37: is getting really serious about renewable energy sources - at least in terms of the law.
Behold §2 of the new 2023 Renewable Energy Sources Act (EEG), under the headline "Special importance of renewable energy sources":
The construction and operation of renewable energy plants and their associated ancillary facilities are in theoverriding public interest andserve public safety.
Let's see what it's worth!
Source: http://www.gesetze-im-internet.de/eeg_2014/__2.html (translation: deepl)
")

@wpschill
Solar produces at day time and hence in hours more likely to spike on the back of higher gas prices.
@aurelwuensch @marcowuensch

@wpschill @aurelwuensch @marcowuensch Just a guess, but can it be an effect due to the missing transmission lines from north to south? Wind generation in the north needs to be stopped while coal and gas are used in the south causing higher market prices at that specific time. Solar is affected less because it is also present in the south and can take a benefit from the high market prices at these times.
@sebastianbe @wpschill @aurelwuensch @marcowuensch wind redispatch in the North has no effect on the energy balance.

@wpschill @marcowuensch
I think that is a result of the unusual seasonality of electricity prices because of gas prices which coincided with the months with more PV production?
@aurelwuensch @wpschill @marcowuensch power settled on high gas prices not only months with more solar, bit also daylight hours.
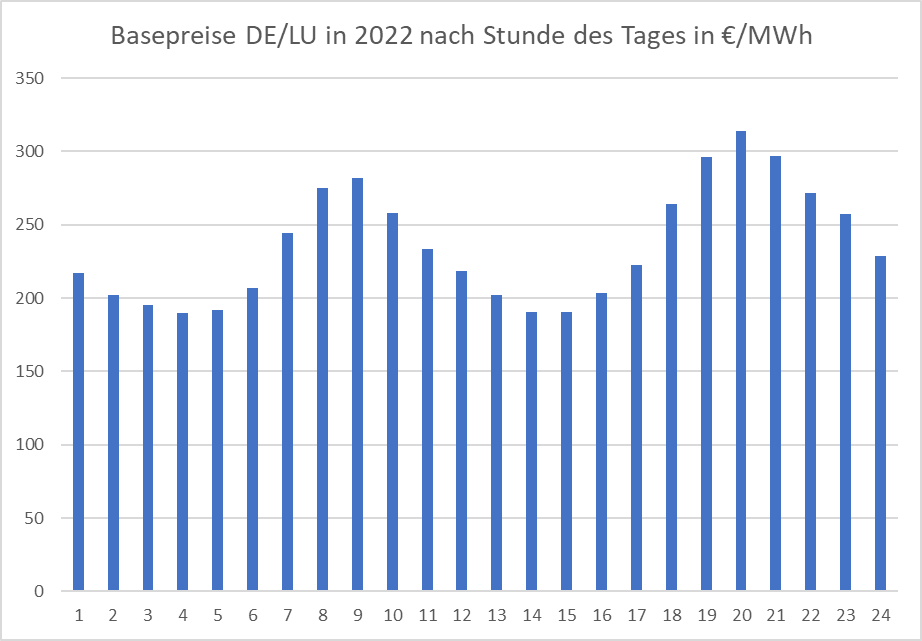
@lostgen @wpschill @marcowuensch wasn't really more expensive during the daytime than in the other hours. (shows whole year, but summer months look similar).
@aurelwuensch @wpschill @marcowuensch In your chart Peak minus offpeak is about 30€/MWh. That explains a good deal of the difference between wind and solar in the chart of @wpschill
@lostgen @wpschill @marcowuensch 8-20 is 239€/MWh, 21-7 is 231€/MWh, so slightly higher but then the hours with highest solar production are even quite a bit below avg.
@aurelwuensch @wpschill @marcowuensch ok then i was squinting
@lostgen @wpschill @marcowuensch I think monthly Data shows it also quite nicely, Wind is pretty even in most months and even higher in some.
@aurelwuensch @lostgen @marcowuensch Thanks, everyone. I really think there is something wrong with the yearly value of the netztransparenz data. I also had a look at monthly data - does not look like PV was doing so relatively good (and even better than in previous years).
@wpschill @lostgen @marcowuensch did you multiply it with monthly generation to weight it?
@wpschill @lostgen @marcowuensch That's one of those fun things where PV could theoretically even be lower in all 12 months than Wind, yet higher yearly.
@aurelwuensch @lostgen @marcowuensch It would of course have to be weighted. But didn't even calculate these numbers, just took them from netztransparenz (see screen shots). Looking at the summer months, where most of PV generation happens, I can't see why i) its market value should be so much higher than wind's, and ii) it mv should be so close to the average spot price in the yearly average. Maybe I'll write netztransparenz to ask what's going on (after my holidays).
@wpschill @marcowuensch If the yearly value is volume weighted, @aurelwuensch has a point that #Solar weights the peak in gas prices extra high because of high summer production.

@wpschill
Thank you for your #GermanEnergyFact thread!
What do you think,, going forward in the year, could it be a good idea to split the hashtag into monthly threads?
Scrolling through the posts and replies should become a bit confusing, what, with Mastodon's way of displaying all replies at the end of the thread, without apparent tie to their parent post?
@anlomedad Thanks, good idea! Maybe that’s also the reason why there has not been too much interaction so far 
@wpschill
Could well be, yes.
I just scrolled through your January # and tbh, I wouldn't even group the hashtag in a monthly thread. Too long... I'd keep them in single posts, or weekly as a maximum, maybe each followed by a reply that explains the concept and how to find the other posts (by clicking on the hashtag, obviously).
I also invented my personal theme hashtag and am also learning how to work better with threads, and with threads regarding my # in my Mastodon account.

A tad sad that you stopped posting the GermanEnergyfacts
Thanks for keeping it up for such a long time tho! I very much enjoyed reading them and searched every once in a while for them to see whether new ones have been posted :)
@mwfc Thanks for the nice feedback! I wasn't sure if anyone even noticed... I was offline for some time, but will resume posting energy facts - although probably not on a daily basis.
Post the stuff in your own pace. :)
I think doing it daily helps creating a habit, but I would never manage to go on for weeks like you did :)
So Thanks for providing all this information!